
Determination of Acceleration Due to Gravity Using Bar Pendulum
1. Aim
To determine the acceleration due to gravity (g) at a place by using a bar pendulum and to study the variation of time period with the distance of the point of suspension from the center of gravity.
2. Apparatus Used
- Bar pendulum (metallic bar with holes)
- Knife-edge support
- Stopwatch (least count 0.1s)
- Meter scale (least count 1mm)
- Spirit level
- Graph paper
3. Diagram
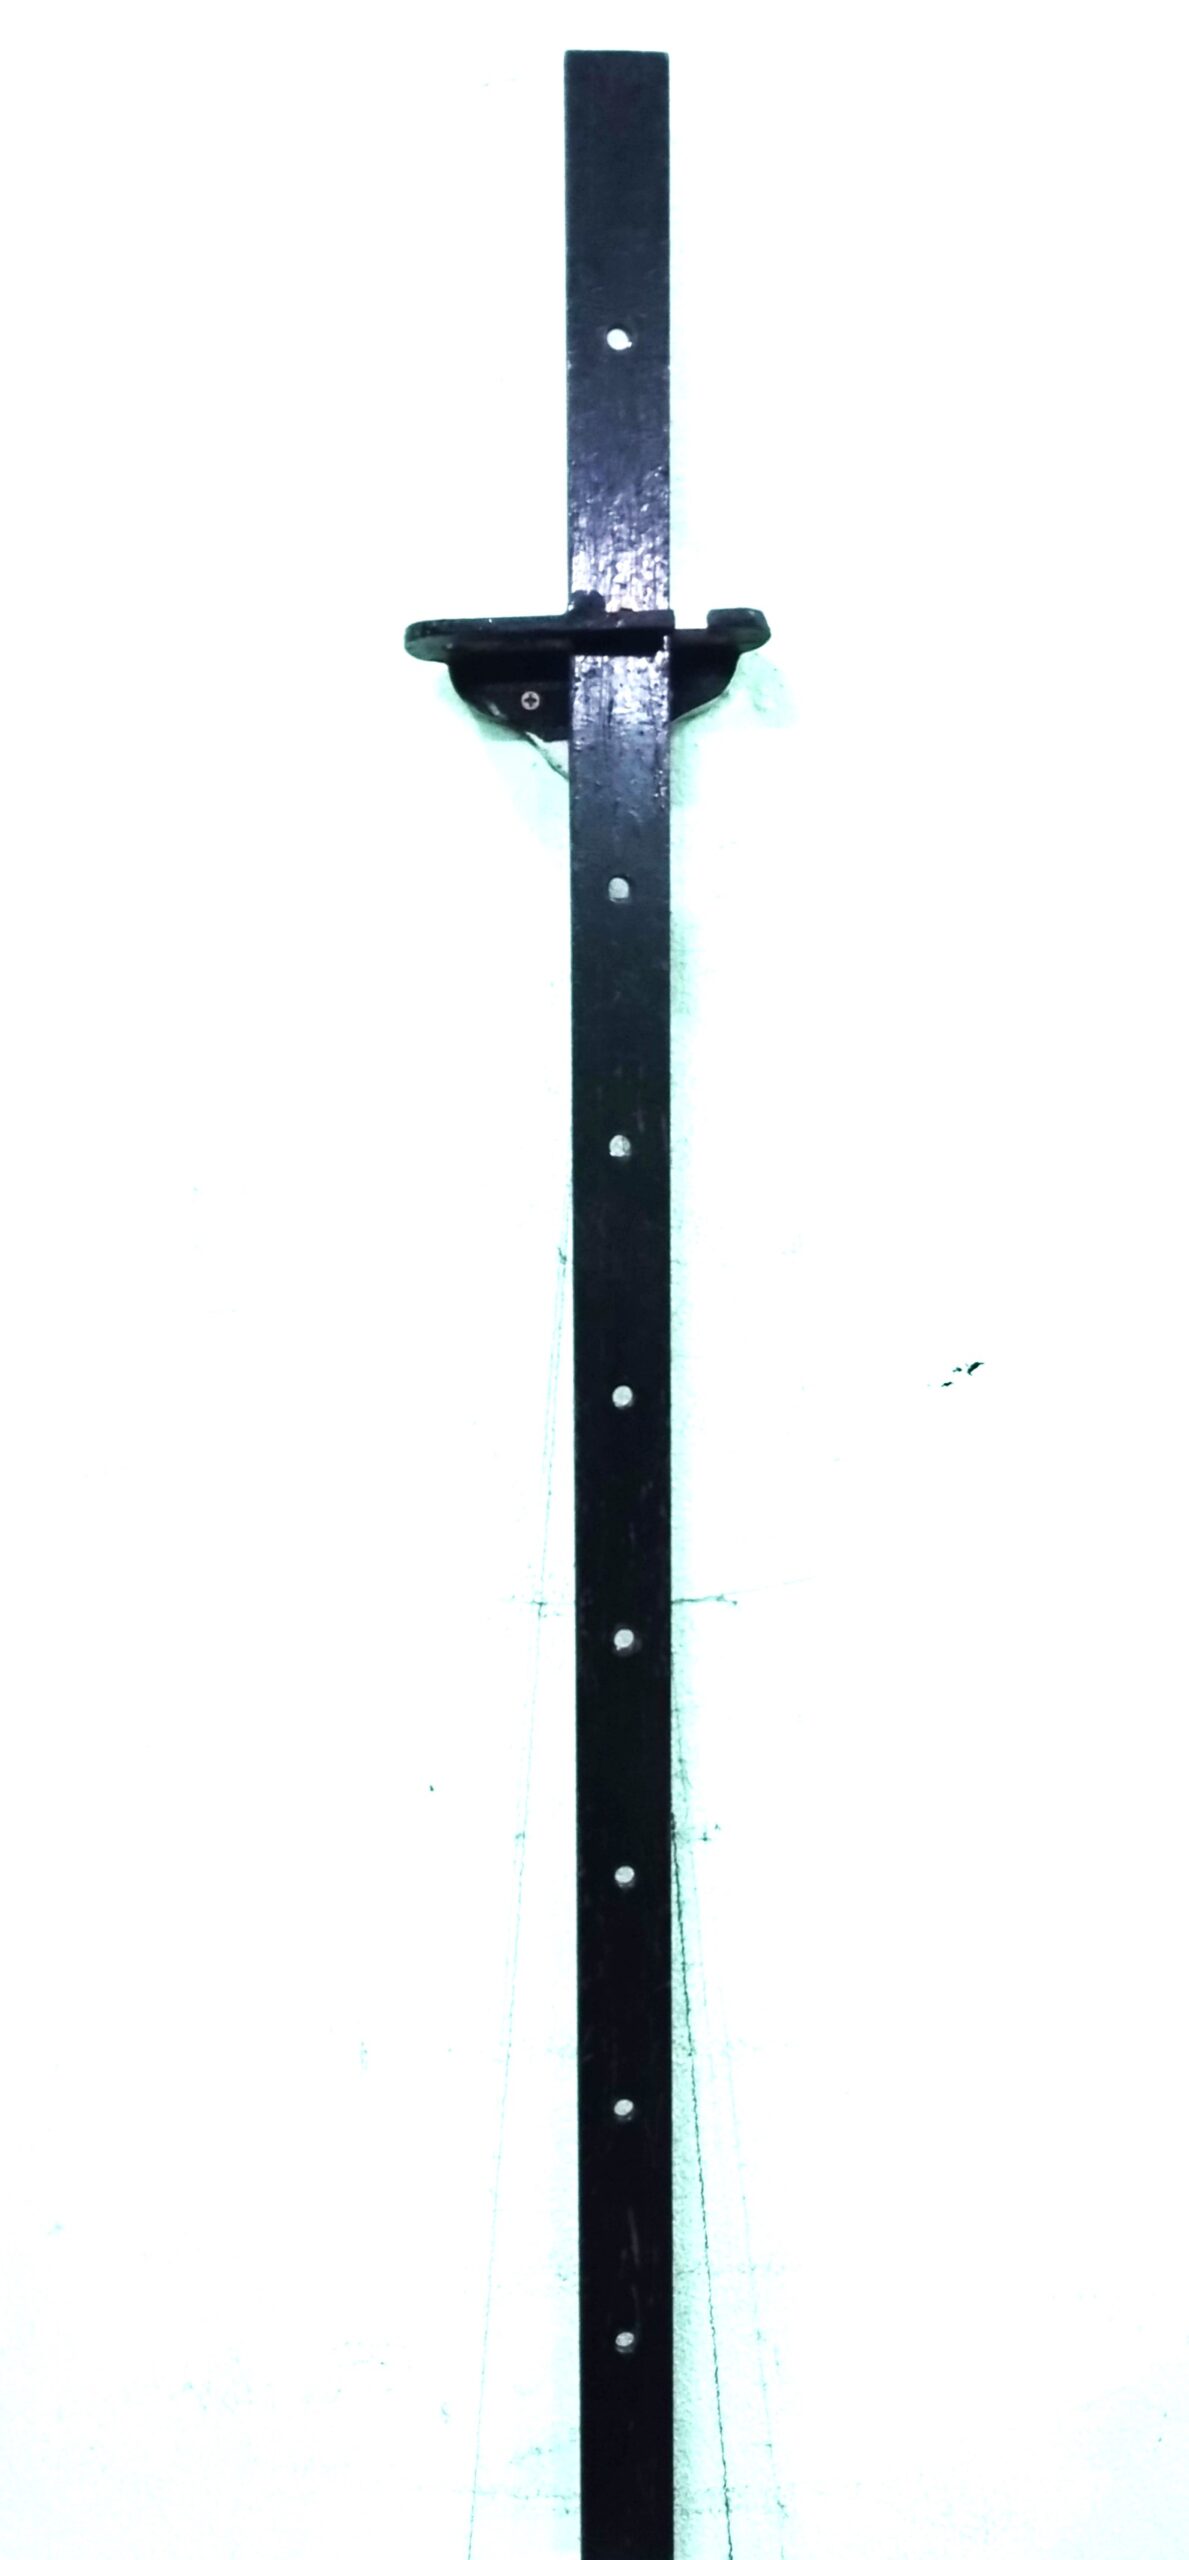
Figure: Bar pendulum suspended from knife edge
4. Theory
A bar pendulum is a rigid body of definite shape that can oscillate about a horizontal axis passing through it. When displaced from its mean position, it executes angular simple harmonic motion.
The time period (T) of oscillation of a bar pendulum is given by:
Where:
- \( T \) = Time period of oscillation
- \( I \) = Moment of inertia about the axis of suspension
- \( m \) = Mass of the pendulum
- \( g \) = Acceleration due to gravity
- \( h \) = Distance between the point of suspension and the center of gravity
Using the parallel axis theorem (\( I = I_0 + mh^2 \)), where \( I_0 \) is the moment of inertia about the center of gravity, the expression becomes:
For a bar pendulum of length \( L \), \( I_0 = \frac{mL^2}{12} \), giving:
5. Formula
The acceleration due to gravity can be calculated using:
At the point where the time period is minimum (\( h = \frac{L}{\sqrt{12}} \)), the formula simplifies to:
6. Procedure
- Determine the center of gravity (CG) of the bar by balancing it on a knife edge.
- Measure the length (L) of the bar from end to end.
- Suspend the bar from one of the holes at a distance h from the CG.
- Displace the bar slightly (about 5°) and release to start oscillations.
- Measure the time for 20 oscillations and calculate the time period (T).
- Repeat the measurement for different suspension points on both sides of the CG.
- Record observations in a tabular form.
- Plot a graph of T versus h and determine \( T_{min} \).
- Calculate 'g' using the appropriate formula.
7. Observation Table
| S.No. | Distance from CG (h) in cm | Time for 20 oscillations (s) | Mean Time Period (T) in s | ||
|---|---|---|---|---|---|
| Trial 1 | Trial 2 | Trial 3 | |||
| 1 | h1 | ||||
| 2 | h2 | ||||
| ... | ... | ||||
Length of bar (L) = _____ cm
Mass of bar (m) = _____ g
8. Calculations
- For each h, calculate the mean time period T using:
\[ T = \frac{\text{Time for 20 oscillations}}{20} \]
- Plot a graph of T (y-axis) versus h (x-axis). The curve will be symmetrical about the CG.
- From the graph, determine \( T_{min} \) and corresponding \( h_{min} \).
- Calculate g using:
\[ g = 4\pi^2 \frac{L^2 + 12h^2}{12hT^2} \]for different h values and take average.
- Alternatively, use:
\[ g = \frac{4\pi^2 L}{T_{min}^2 \sqrt{3}} \]with \( T_{min} \) from the graph.
Graph Plotting Instructions
Plot T (y-axis) vs h (x-axis):
- The curve should show two symmetrical branches
- Mark the minimum time period point (\( T_{min} \))
- Draw horizontal lines corresponding to \( T_1 = T_2 \) to find equivalent length points
9. Result
- The acceleration due to gravity (g) determined from the experiment = _____ m/s²
- Standard value of g at the location = _____ m/s²
- Percentage error = _____ %
10. Precautions
- Ensure the knife edge is horizontal using a spirit level
- Amplitude of oscillation should be small (≤ 5°)
- Time at least 20 oscillations to reduce timing errors
- Measure distances from CG accurately
- Avoid air currents that may affect oscillations
- Repeat measurements for each position to minimize errors